Friday, April 11, 2025

00 Intro


90 

Rising Park Science Club

All the schools in Fairfield County


I see lots of info about coming events in the sky but most people don't know where to look or what time. Lots see it by accident I guess. How many are into degrees. 
Try this using a clock, point 12 north on the map, look that direction and that object will be in the direction of the minute hand. (also elevation needs to be considered) it will appear if it is above the horizon and there are no obsticals in the way 😏

Might include a location it can be seen if it is a major event.


I like to share my interest with others I guess. I spend hours on the computer and taking pics at Rising Park (Mostly Mount Pleasant)

Thinking of my self and others I see working at different jobs, all the things taught but never put to use.

I would suggest an applied sience study or group.

Taking photos is so easy tody, just point and shoot. There are others that gain a passion .. they strive to create the perfect pic.

Seeing photos of prom kids in the gazebo on a sunny day, backlit and hardly visible.

Families under trees with the sun streaming through with spider web shadows.

What I purpose is not just for LHS but every school in the county. Someone contacting the teachers in the area.

The principals learned at Rising Park can be applied any where in the world.

I remember school trips and know classes go on trips at great distances, even other countries.

Rising Park is in our own back yard. 

Being part of a large group with common interest is so cool, imagining the groups from all the counties having events here a couple times a year.

Weather science

When to schedule the meeting?

Not using the weather stations but by looking at the National Weather .


So many times I saw a great sky and by the time I got to the top of Mt Pleasant it was overcast.

Weather forcasting being a major part of the group science .

Biology, Chemistry.. their labs repeat similar things every year. They enhance or change things too.

The airport publishes stats often


Apr 8, 6:05 am 27 16 63 15 N 14 10.00   BKN032   29.08 30.01

By taking pics of the sky and entering the stats, it could be entered into a spread sheet.

Creating data for different conditions, they could look at a forcast, enter it in the sheet and sort by different fields and project the probable conditions.. it is science. Collecting data to determine the outcome of things.

Watching the weather daily, I thought if you had a group to watch the news, and later give them a test of things stated in the weather report.. what do you think 


I am thinking of a local weather lab, the schools might even have their own weather stations.  Indeed the weather is an on going topic .. an applied science.

Astronomy.. 

There is something awesome about standing on high places looking at the foreground below. You will see hundreds of images .. "Take my Picture" 

Standing on Mt Pleasant pointing the camera at 270 degrees (day of the equanox)
On top of the world (Mount Pleasant) where the sunsets, June 20, March 20, Dec 20th


Take a pic at that direction on June 20th March 20th and Jan 20th 

I never earn money with this hobby but have spent $$$. The media to publish this is FREE.. Google blogs, sheets, maps, youtube space.

Just some of my thoughts on P Photograph

A snippet of my pics .

I would not be involved. If classes in local schools like the idea they would do the organizing and communicating.
I can share how I have organized.. using free internet resources and fill in lots more that I have thought over the years. 

I guess anyone can subscribe to this blog to get updates. My spelling.. grammar ugh. 
You might spin the idea to your students n take in their reaction.


Guess this FB account can be used if anyone wants to contact me. I think Google groups is great. Like other social media but you can send and recieve input by email or turn it off, and do it on the web site. 

I have a text number I never use but guess it works ‪(380) 228-0593‬


04 QC

97

Quality control.. 

The theme of the study is science study of the elements and natural light conditions.

Being 'scientist' rigid control would be essential

People bet on everything. Seeing them buying books, using charts n stats to pick. Weather forcasting seems to be in the park of .. might get it on the button some times but..

Here there could be a competiton between schools to which was most accurate in their predictions. (Saw the weather forcasters doing this).

The BIG difference this special course would concentrate what effect the conditions would have on the outdoor appearance and how different conditions affected photography.

I have one place I can see the sky, Having a single place, pointing the camera the same direction to collect data.

Cameras keep meta data, to establish the time a pic was taken. The same camera, with the same settings used to include the data. 
In film photography we used light meters. Cameras can do the same thing. The apeture and shutter speed can (kind of) be a tool to measure the brightness of the sky when a pic was taken.

The National Weather service includes some past stats and predicts future condition.

The airport, only provides past along as what is happening at present.


The amount of clouds in your area can be viewed from space and you can point your camera up at em. 


If interesting pics were taken years ago and you know the time of that day, you can go back years to look them up.

Christmas 1970 ( https://www.wunderground.com/history/daily/KLCK/date/1970-12-25 ) 

Time
Temperature
Dew Point
Humidity
Wind
Wind Speed
Wind Gust
Pressure
Precip.
Condition

Storage of pics could be in facebook albums and data in spreadsheets.

How to get that done, here is where your class computer skills could be integrated

The software could glean the meta data, post the picture, caputure the data from the weather services to tie them together.

.


There are thousands of photos like these. Classes on outdoor adventures.  

In school we had different outings .. had to take home a note for your parents to sign. Bands, football teams .. travel.

I saw where LHS has a drive to save their Planetarium ... If all the schools in the county were involved in this 'course' I would guess they would find more interest in their telescope.. 

(Visual) astronomy being integrated, meaning what can be observed with out special equipment. Through the years that I have been taking photographs here, capturing people with others pointing out some special thing.

Meeting visitors coming for the first time or those who moved away and came back with their kids to bring them up to look out over our turf, to share. 

It ain't Paris but in a few years that experience will only be photos pasted in social media. For those who live or moved here to make the pilgrimage, it becomes a part of us. When I placed " lancaster ohio `mount pleasant' " there were over over 630,000 links to click on. Not a trivial fraction of the photos I have taken here.  Millions from others. A bit of social science 😋


One of our teachers took the class out to look at birds.
Studying inside .. the norm, but I would bet if the class could come out to Mt Pleasant to do their studies they would jump. 
The sky appearance connected to weather stats, the study of our trip around the sun.. yep in broad daylight the moon can be viewed on certain days of the year.


We have the perfect outdoor lab for earth science studies. 


NTD 

 https://forecast.weather.gov/MapClick.php?lat=39.7203&lon=-82.6043&lg=english&&FcstType=graphical&dd=1&bw=1


Cloud cover 

https://www.accuweather.com/en/us/lancaster/43130/satellite/330110


Local report

 https://www.accuweather.com/en/us/lancaster/43130/daily-weather-forecast/330110#google_vignette


Airport

 https://www.weather.gov/wrh/timeseries?site=KLHQ


History

 https://www.wunderground.com/history


Thursday, April 10, 2025

03 Data tool


FEW048   A link to pics as easy as test 

Just created this spread sheet for show n tell. There is some info on the airport data not important, instead of deleting those columns, I just made the columns very thin. The copy and paste from the aport stats, finds its place :) Columns can be hidden but if curious, anyone can click on em to peek.


Once pics of clouds are on your computer you can view them with your browser
Mine c:\clouds
Creating a facebook album uploading them. This info is lost on fb so as you upload them

Copy the info for each and paste as a comment.


NameSizeDate Modified
desktop.ini140 B4/13/25, 1:19:21 PM
DSC02256.JPG8.9 MB4/8/25, 7:48:44 PM
DSC02258.JPG9.8 MB4/13/25, 2:00:06 PM
DSC02259.JPG10.3 MB4/13/25, 2:02:49 PM
DSC02260.JPG9.9 MB4/12/25, 12:15:52 PM
DSC02261.JPG9.4 MB
Then go to https://www.weather.gov/wrh/timeseries?site=KLHQ, you can find the data for the time that pic was taken
Then you can paste the weather data in (mine ) your spreadsheet, the data with links to your cloud pic on facebook.


Wednesday, April 9, 2025

01 Researchers

 Who does not have a cell phone connected to the internet.. (Me an old guy but).

Dates and times are printed to metadata on photos. When looking at photo data it can be modified ...

It is important to use date taken. 

Past conditions https://www.wunderground.com/history y/m/d,

Lancaster Airport https://www.weather.gov/wrh/timeseries?site=KLHQ 

National Weather https://forecast.weather.gov/MapClick.php?lat=39.7203&lon=-82.6043&lg=english&&FcstType=graphical&dd=1&bw=1

Schools have computer programming skills that can do the job, I had to use a macro.

Double clicking my macro copies the screen of planets today, copies the forcast for sunset time that day, pastes it into a file, takes me to a facebook page to paste it on the daily data where I can add comments.. such as pics of clouds at that given time.

The airport includes codes CLR FEW SCT BKN OVC ...

Apr 8, 1:05 am 36 26 69 33 NNW 3 10.00 SCT080 28.98 29.90 

Apr 8, 1:00 am 36 25 64 32 NNW 5 10.00 BKN080 28.98 29.90 

Apr 8, 12:55 am 36 26 69 31 NNW 6 10.00 OVC080 28.98 29.90 

Some times just the code letters but also include numbers that indicate some kind of degree. So far my guess these codes and numbers represent the appearence of the sky at that time?

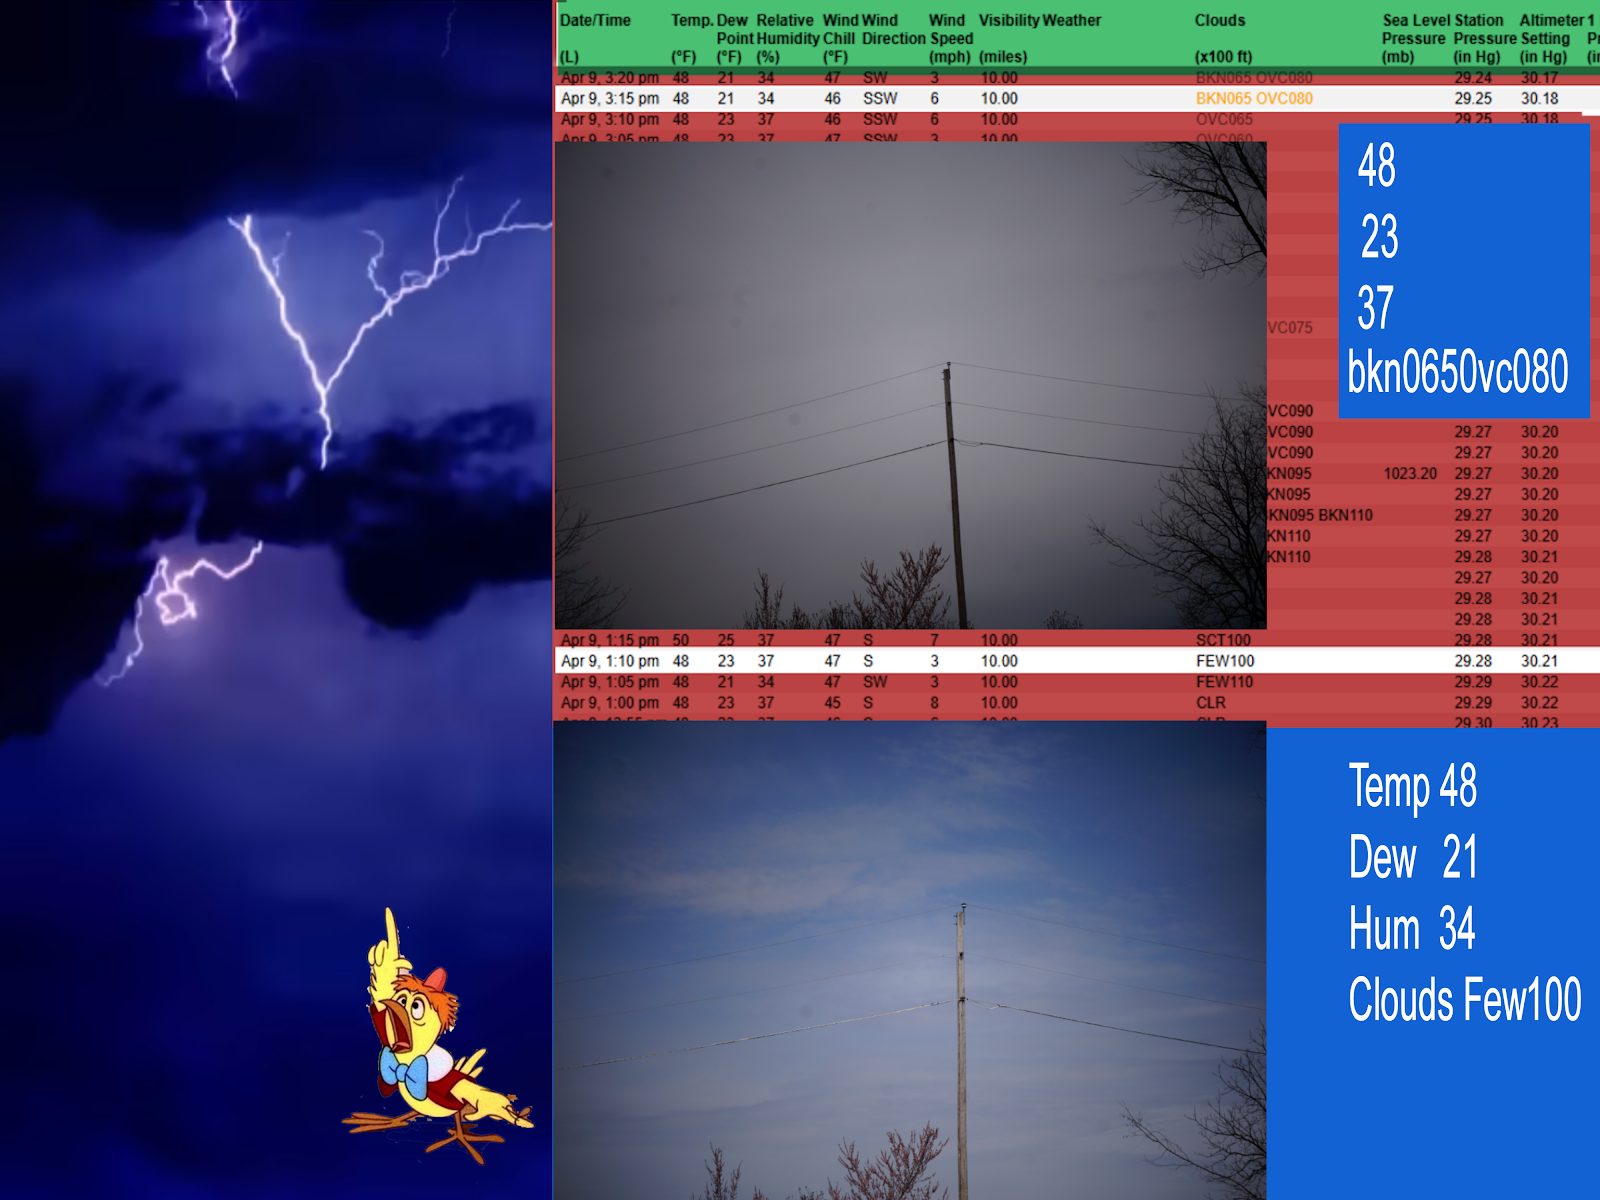
I just went out to take this pic then look to see what the data was.

Apr 9, 1:10 pm48233747S310.00 FEW100 29.2830.21 


Apr 9, 3:10 pm48233746SSW610.00 OVC065 29.2530.18 


Time is essential.. not the day. Yesterday I took 3 pics at different times and they were all different. I took these today and included the weather data. The numbers, abbrebations indicate what the sky will look like .
This would be a great project for a science fair. 

In a few minutes it was dark and gloomy then  bright with blue sky in big spots. I don't think there is a code for fluxiating appearances but it could be created.

Because of all the trees on my property I can not see the sky but point the camera across the neighbor's property with this pole as a marker. A direction the camera is not pointing at the sun.

Google spread sheets are created so others can use them but not modify them.
Here a facebook cloud album could be created. Interesting cloud photos added and the spreadsheet having the data with a link to that pic.

My facebook pages have pics of related maps and other things like this one https://www.facebook.com/photo/?fbid=122149150034292075&set=oa.903339811513298 

One thing I can't do is look at the sky and identify what type cloud it is. A fun thing teachers in any class might do on some days is to tell the kids to look out the windows and write down the type in their imaginary book.. no need to fess up they didnt know  .. and anyone who wanted might share what they thought and why. 😉

Most people will discuss, watch ... think about weather through out their lives and some will be involved in business a launching pad kind of https://www.weather.gov/education